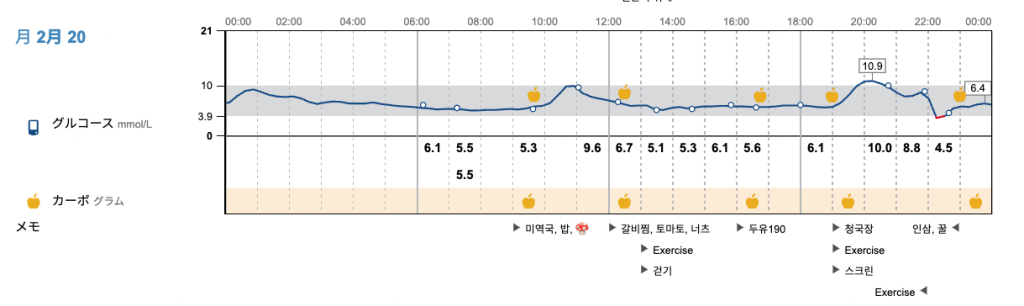
I had a Freestyle Libre sensor, a CGM (Continuous Glucose Monitoring) useful for diabetic or pre-diabetic patients, which allows you to measure your glucose level through day and night for two weeks. Using an NFC-enabled smartphone, you can monitor the sensor values and then it automatically upload them to their web server LibreView .
The site gives you a very detailed results of the measurement. However, the resolution of the plot is not fine enough and the annotated texts are just aligned with 30-minutes intervals, thus making it harder to guess which foods and activities cause the glucose level changes.
Also, the unit of the measurement is mmol/L but I want it to be mg/dL. The setting somehow doesn’t allow me to change it – maybe my Google account still has my address in Canada. It looks like below.
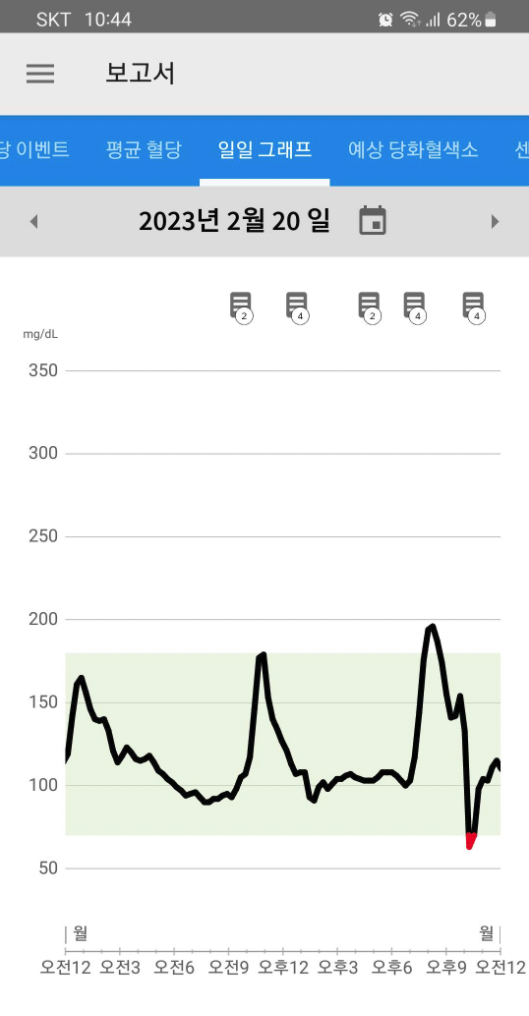
Their smartphone app also provides the daily plot which has better y-axis resolution but x-axis resolution is very low and the annotated texts are just not shown.
Frustrated, I decided to create an app to satisfy all my needs as a weekend project.
Luckly, LibreView also provides a CSV file which contains all the information.
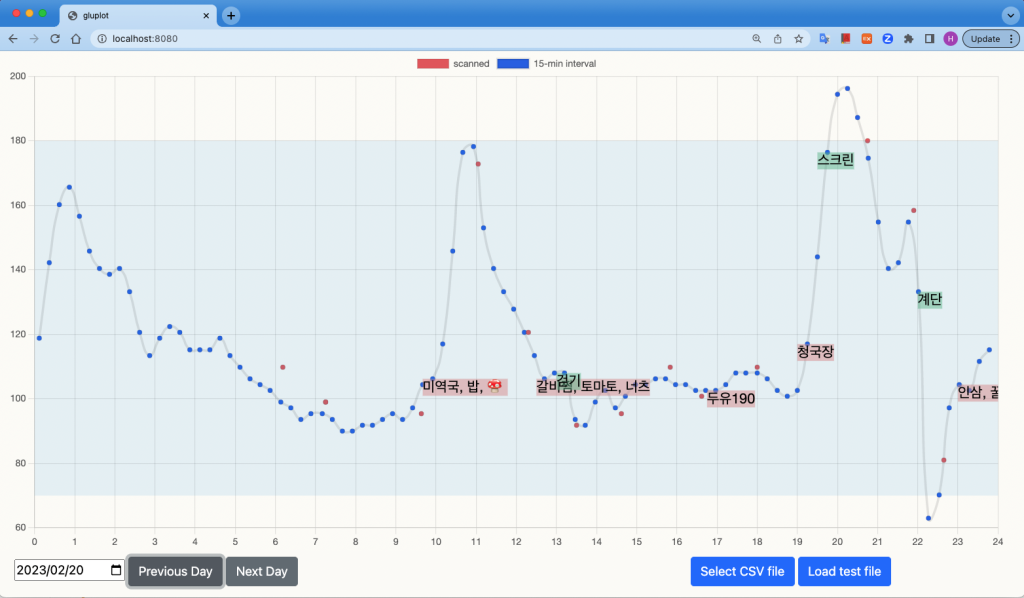
Here’s the plot of my app.
Technologies
- Javascript – it’s a simple web app. No server-side code.
- Chart.js – a very flexible graph plot library with full control of how axes are drawn
- chart-js-plugin-annotation – a plugin for Chart.js needed to display floating labels on the plot.
- Bootstrap – just used it to make the buttons look nicer.
The app is running on gluplot. You can test with your CSV file if you have one.
Code in github.